
Build systematic trading
strategies with AI.
Describe a strategy in plain English. QuantGenie builds it, backtests it on institutional-grade data, and deploys it to your broker — no code required.
Free 5-day trial on Lite & Pro · Limited time: unlimited token usage for all Open Beta users

Ingest market data
tick → 1mo, full history
Build the strategy
validated, deterministic
Backtest
realistic fill modeling
Monte Carlo
1,000 reshuffled runs
In / out-of-sample
graded on unseen data
Approve & deploy
your broker, one click
Ingest market data
tick → 1mo, full history
Build the strategy
validated, deterministic
Backtest
realistic fill modeling
Monte Carlo
1,000 reshuffled runs
In / out-of-sample
graded on unseen data
Approve & deploy
your broker, one click
Institutional market data, built in
Included with every subscriptionPremium institutional tick data across US equities and major futures — cleaned to the standard the biggest firms pay for. No separate data vendor, no API keys. Describe a strategy and start testing.
Tick → 1mo
Bar resolutions
Every tick to monthly bars — equities & futures
19 yrs
US equities
Tick-level history across the full US equity market
11 yrs
Futures
Major CME markets, back-adjusted continuous
Soon
Options & crypto
Options chains and crypto data — coming soon
Watch a sentence become a strategy.
Describe
Plain English in. A validated, deterministic strategy out. The AI asks when it's unsure — it never guesses.
- No code — describe it like you'd explain it to a friend
- A hard validation gate keeps broken logic out
- Same input, same strategy, every run
See & shape
Your strategy as a logic tree you can read and rearrange. Every block is exact math — never improvised.
- Drag, drop, and rewire the logic visually
- Copy, remix, and version any strategy
- What you read is exactly what runs
Prove
Backtest on institutional data, then interrogate the results. Ask why it lost in March. It knows.
- Full performance suite on every run — labeled backtested
- Ask the AI questions about any result
- Compare variations before a dollar is at risk
The whole firm, as software
A quantitative fund runs on seven functions. QuantGenie ships all of them.
Research & data intake
Institutional-grade market data flows in — 19 years of equities, 11 years of futures, full security master. The whole graveyard, not just the survivors.
Bid / Ask · ES
5287.00 / 5287.25Day's range
5243.00 – 5299.50Delistings, ticker changes, corporate actions — all kept.
Build
Your plain-English idea becomes a real, validated strategy. A hard validation gate keeps broken logic out; the AI asks instead of guessing.
Signal
Filter
Risk
Execution
No logic errors
All conditions valid
Backtest ready
Backtest
Real-fill modeling against premium tick data — edge that survives contact with a real order book, not benefit-of-the-doubt fills.
Stress-test
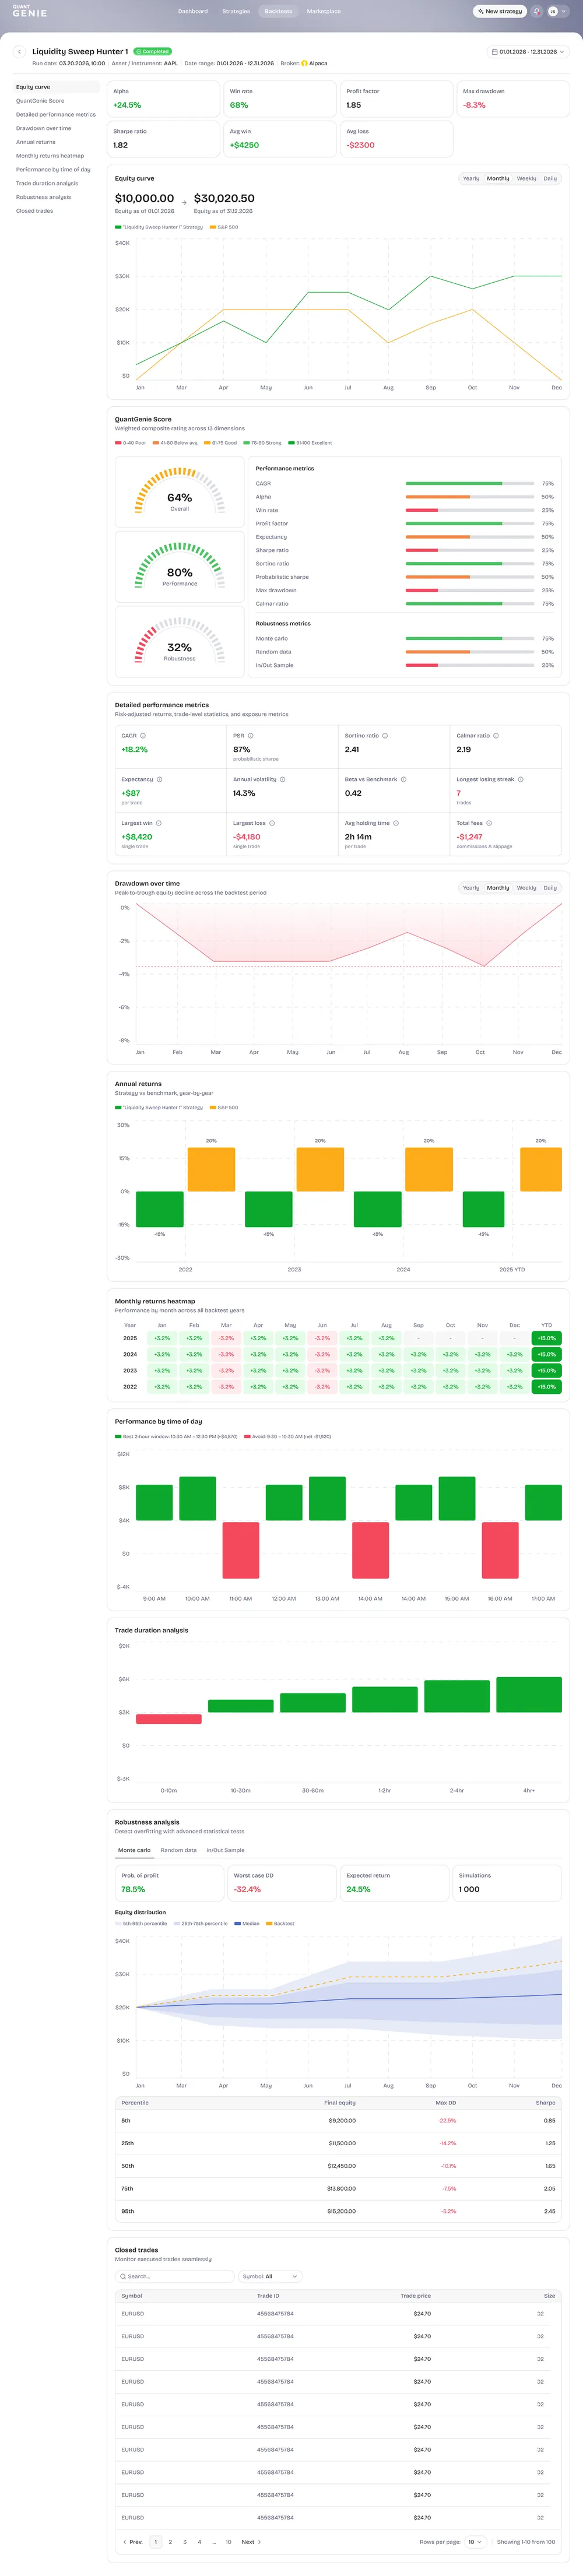
Monte Carlo reshuffles, in-sample/out-of-sample splits, and the QuantGenie Score grade every strategy before a dollar is at risk. All results are historical simulations.
Deploy
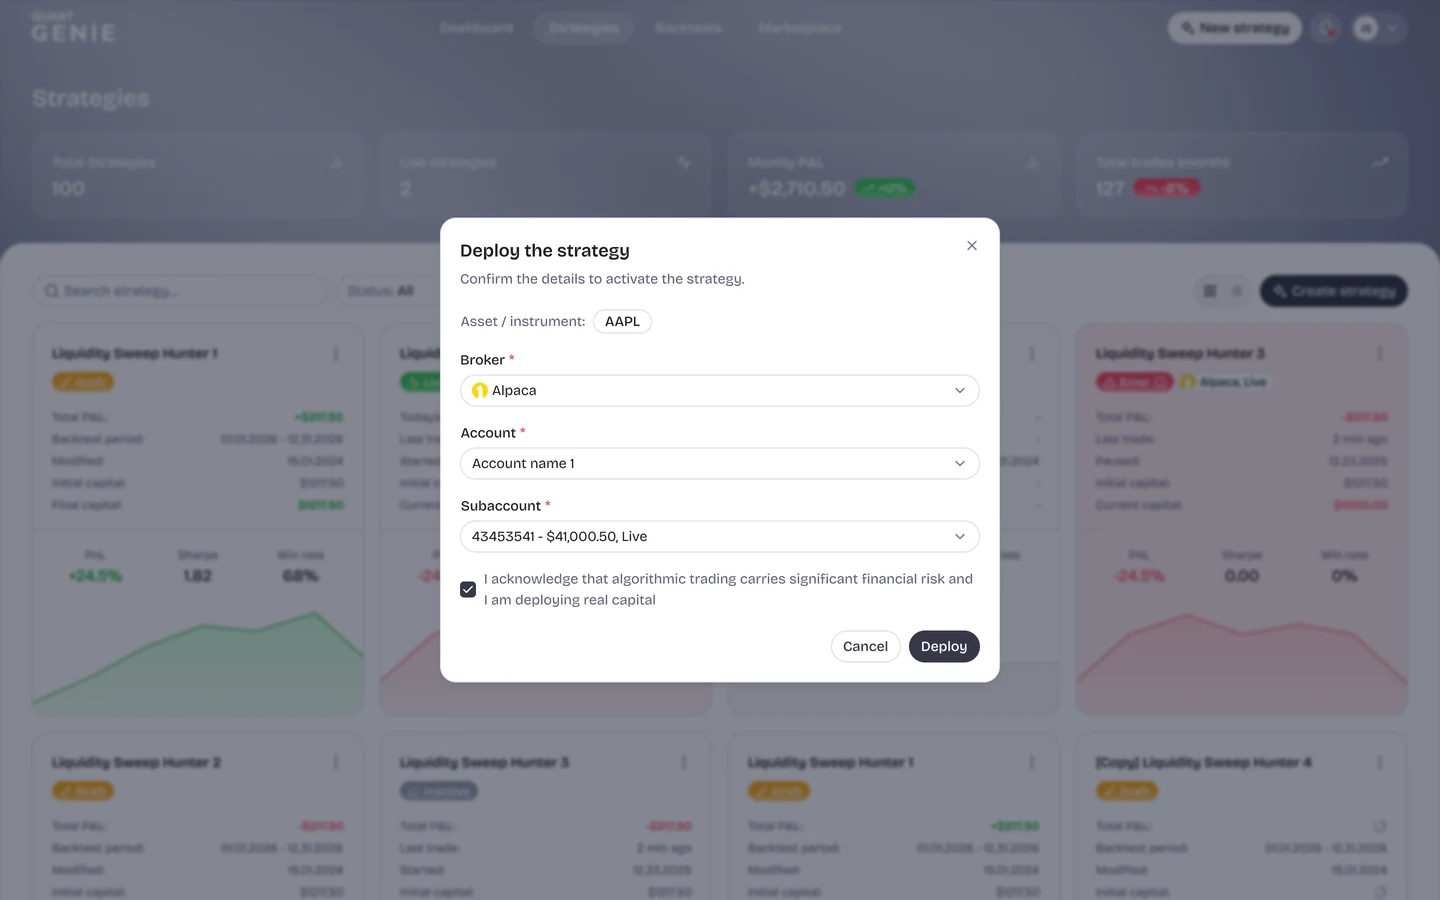
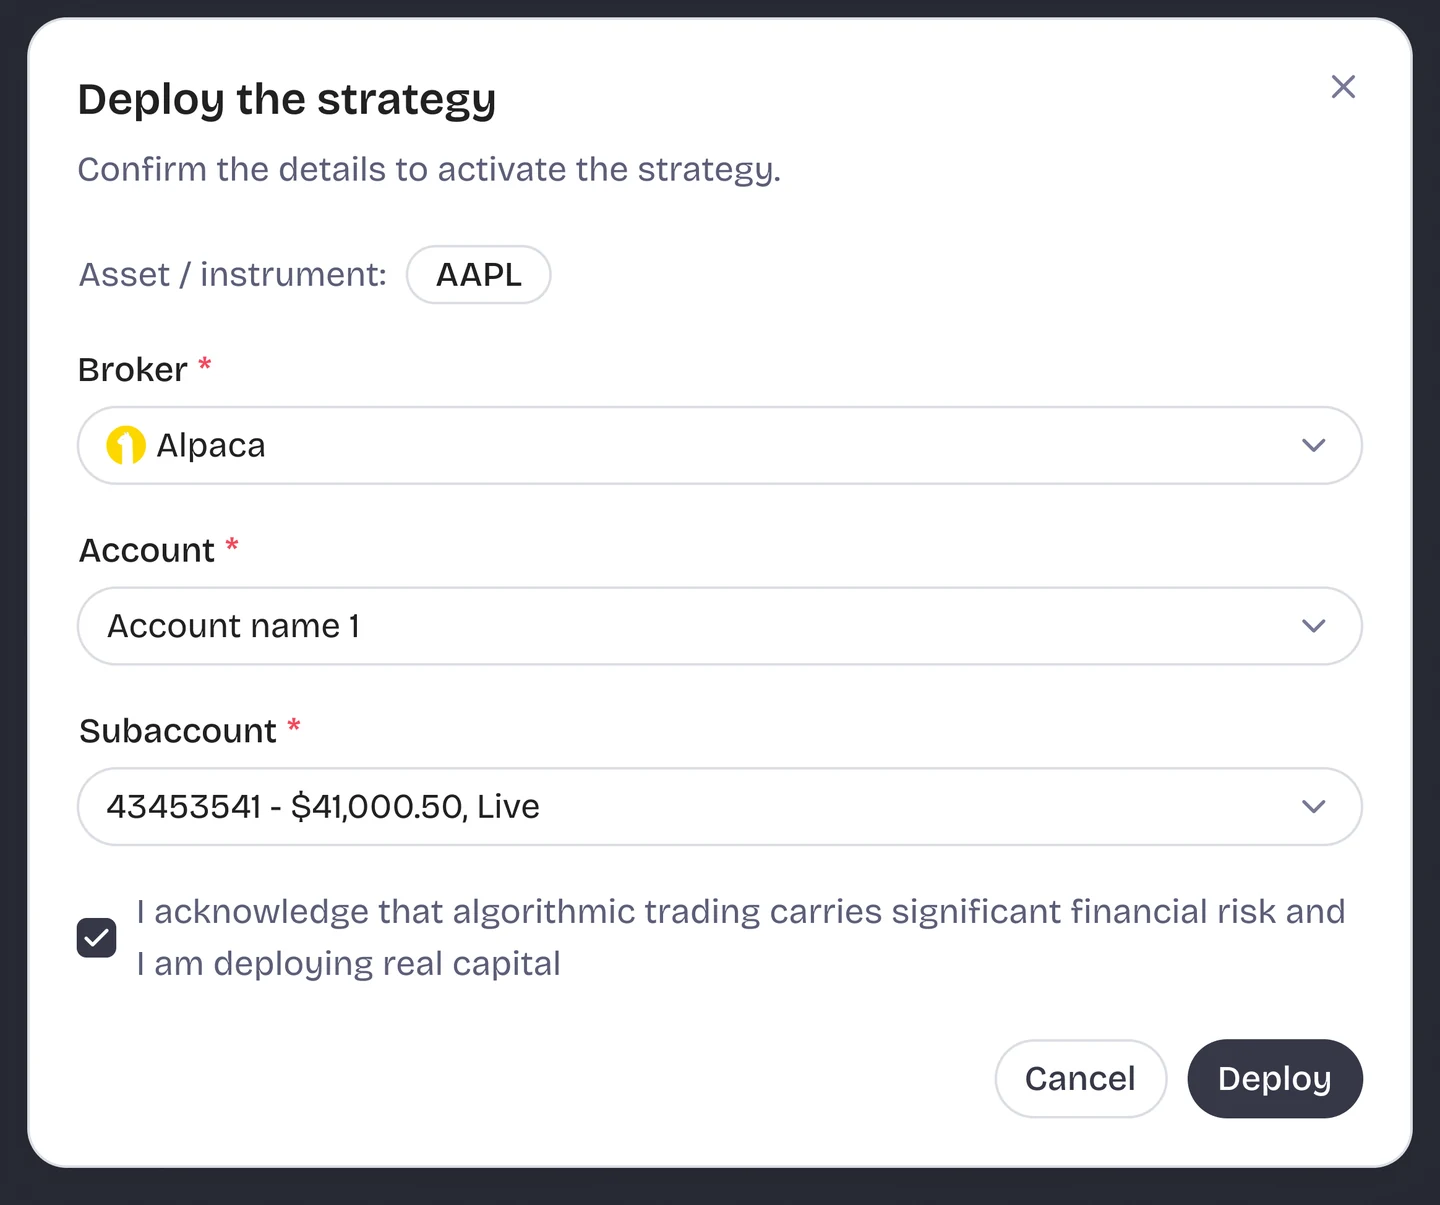
One click to your broker via revocable OAuth. Runs server-side 24/7 in its own sub-account — clean P&L by construction.
Monitor
One dashboard for your whole book: positions, exposure, drawdown, backtest vs live — and an instant OFF switch on everything.
Open P&L
+$1,284Exposure
38.2%Drawdown
-2.1%Positions
4Refine & rebalance
Git-style versioning and a full audit trail. Adjust a rule, re-test, redeploy — your fund improves the way real firms do: iteratively.
Adjusted volatility filter · re-tested
Frozen snapshot behind every backtest
"Why did it buy there?" always has an answer
Does your strategy actually have alpha?
Every strategy runs the four-lens validation suite a fund desk would demand — so you separate real edge from a lucky curve in minutes, not months.
The numbers that matter.
Every backtest opens with the stats pros read first. Profit factor — gross wins ÷ gross losses — tells you whether winners actually pay for the losers. Win rate, Sharpe (return per unit of risk), and max drawdown (the worst drop you'd have sat through) complete the picture. One metric alone can flatter a bad strategy; the combination is much harder to fool.
Backtest · 19 years · institutional data
+$32,000backtested
QuantGenie Score
86
Profit factor
1.85
Win rate
68%
Sharpe
1.82
Max drawdown
-8.3%
Total return
+24.5%
Trades
172
Historical simulation, not a guarantee of future results.
Monte Carlo — stress-test the luck out of it.
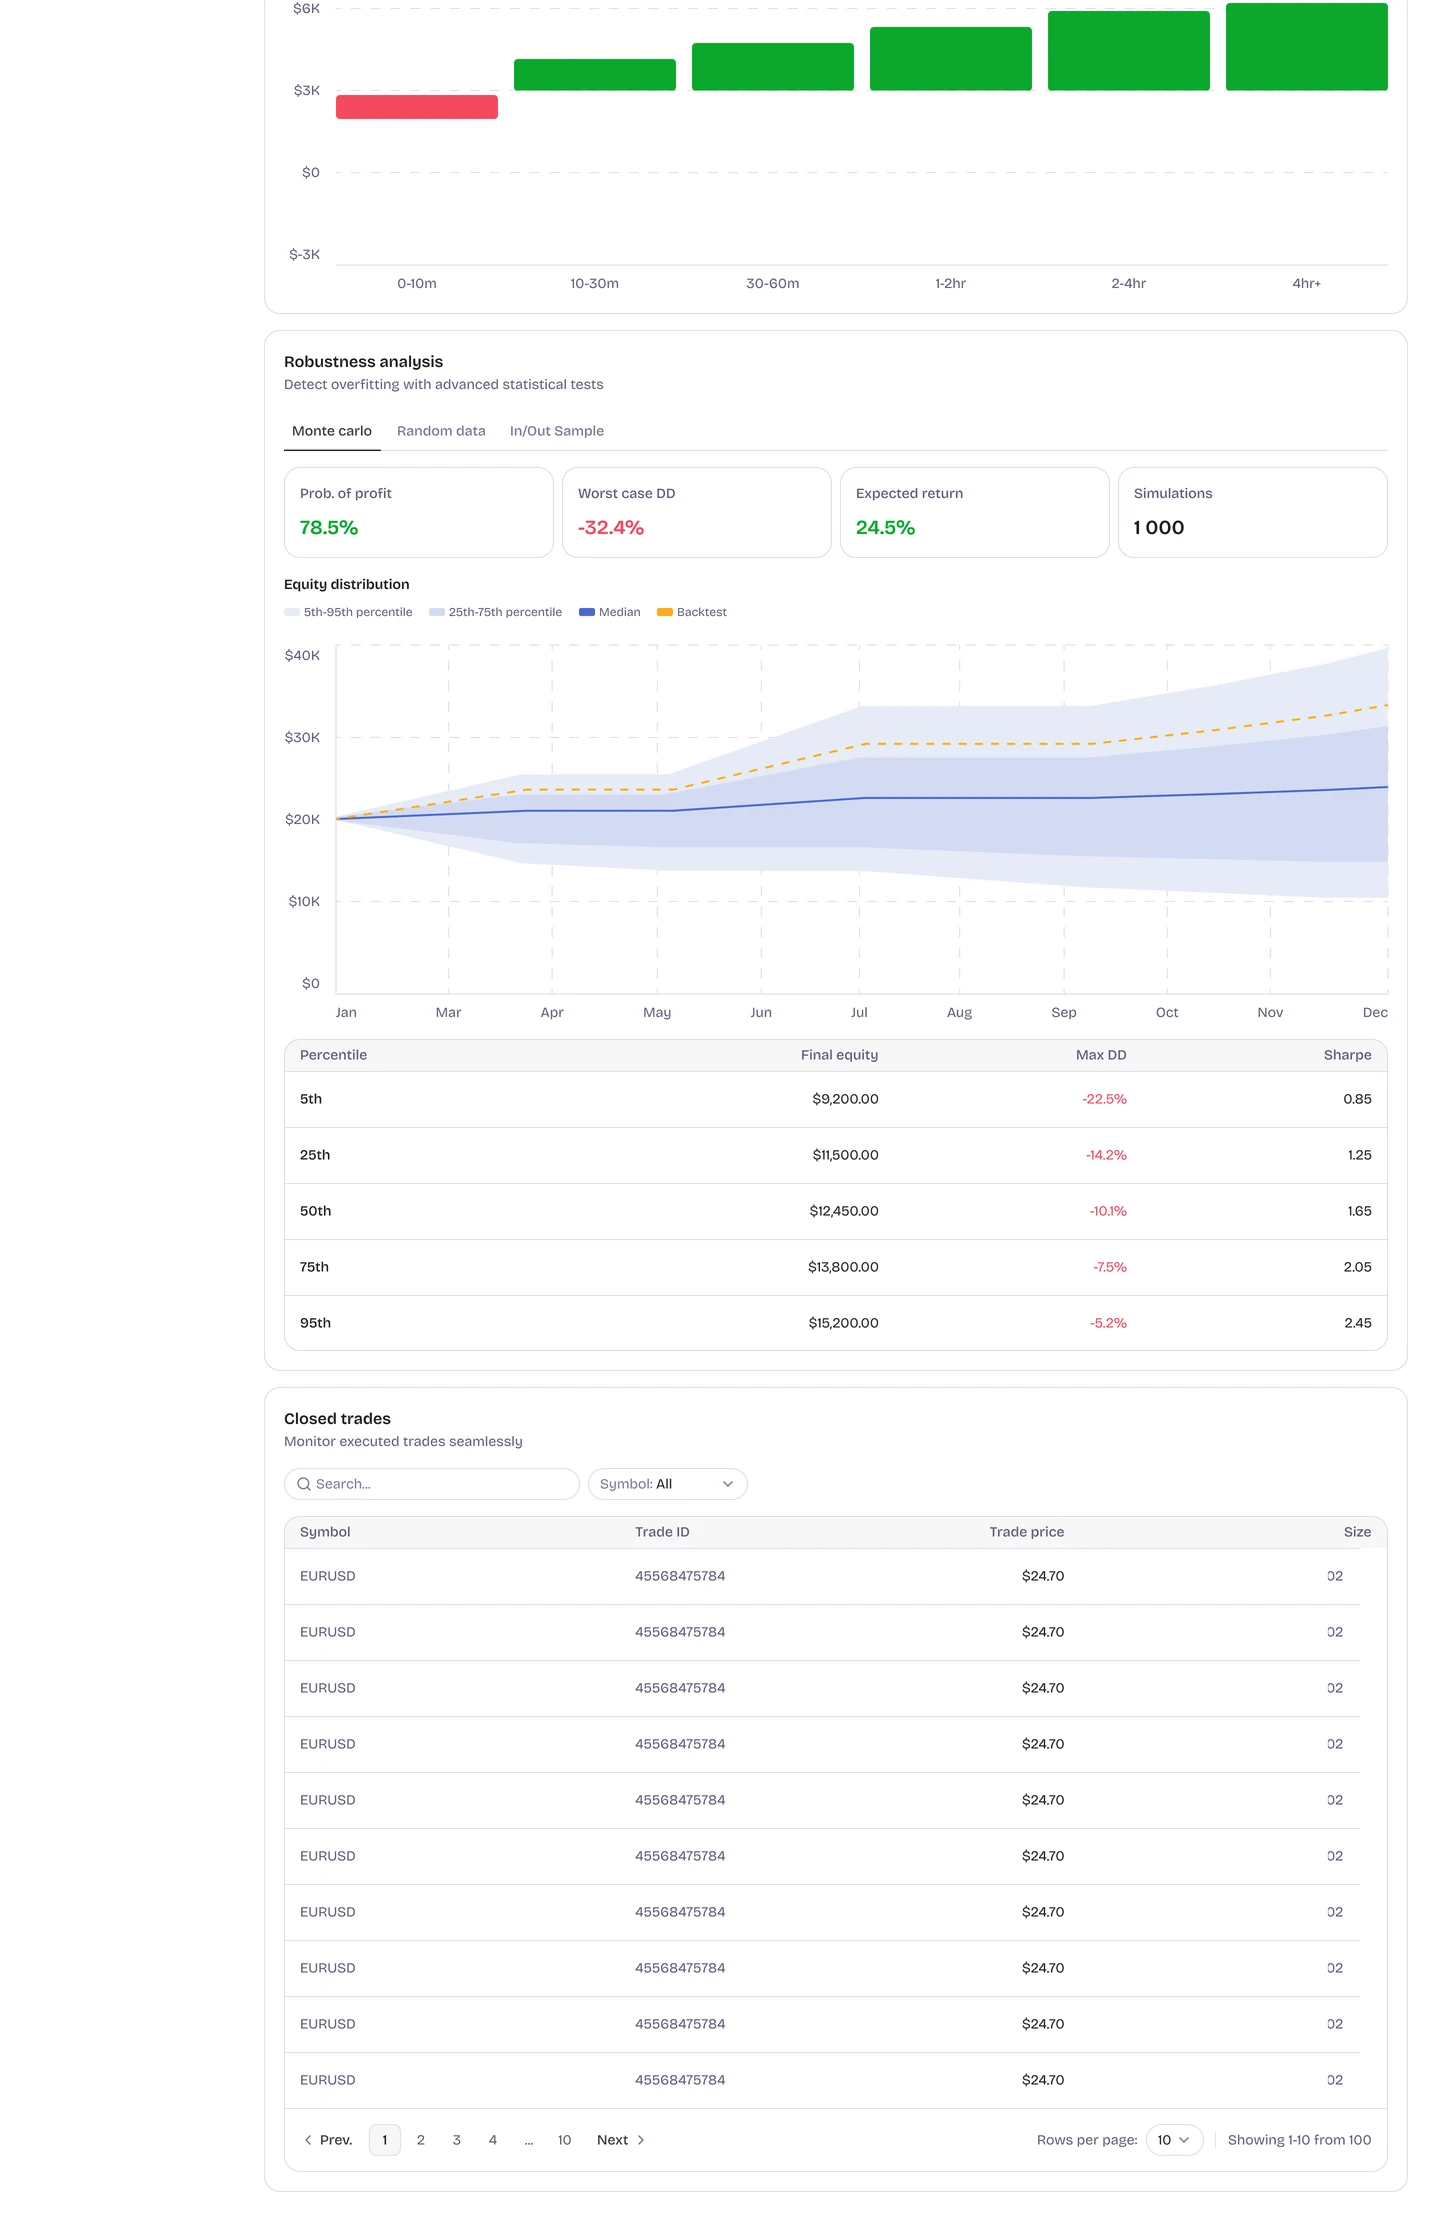
We re-run your strategy's trades in 1,000 shuffled sequences to reveal the range of outcomes, not one lucky path: probability of profit, worst-case drawdown, and the full equity distribution. If the edge only shows up in one ordering of trades, it was luck — better to find out here than in your account.
Robustness analysis
Detect overfitting with advanced statistical tests
Prob. of profit
78.5%
Worst-case DD
-32.4%
Simulations
1,000
In/out-of-sample — the overfit killer.
The strategy learns on the first 70% of history, then gets graded on the last 30% it has never seen. Edge that holds on unseen data is the closest thing backtesting has to proof. Edge that collapses at the divider memorized the past — QuantGenie shows you which one you're holding, before you risk a dollar.
Robustness analysis
Trained vs untested data — did it keep working?
Looks robust. The strategy kept performing on data it had never seen — out-of-sample Sharpe held within the healthy range.
Overfit strategies fall off a cliff right at the divider.
Walk-forward — a dress rehearsal for live.
The strategy is re-optimized on a rolling window of history, then graded on the months it hasn't seen yet — again and again, across years. It's the closest a backtest gets to simulating real deployment, and it's how institutions decide what actually gets capital.
Robustness analysis
Sequential re-optimization across rolling windows
W1 '20
+24.3%
W2 '21
+18.7%
W3 '22
+22.1%
W4 '23
+19.6%
W5 '24
+27.8%
Avg OOS Sharpe
1.71
Best window
2.34
Consistency
82%
Re-optimized each window, graded on the months it never saw. Historical simulation.
Your backtest is only as honest
as its data.
- The whole graveyard, not just the winners. Full security master — delistings, ticker changes, corporate actions all kept. Free feeds quietly delete the losers.
- Institutional-grade tick data. 19 years of equities, 11 years of futures — the tier real quant firms pay for, not the standard retail feed.
- Real fills, not benefit-of-the-doubt fills. 40–50% of US volume prints off-exchange at prices no real order could reach — dirty data only ever flatters you.
Do not trust the curve. Test the system.
Same strategy. Same period. Backtested twice.
Raw bars
+31%
phantom fills included
Tradable prices
+12%
the edge that was real
Historical simulation on institutional data. The other 19 points never existed — no order could have filled there. Backtested results are not guarantees of future performance.
Not another GPT wrapper.
Deterministic by design.
Generic AI improvises trading logic — same prompt, different bot every time. QuantGenie's engine is validated before it runs and identical every run. No mood swings.
Broken logic can't reach the engine
Every strategy passes a hard validation gate first. If it passes, it's your real strategy — not an approximation.
Your concepts, one canonical definition
FVGs, liquidity sweeps, session windows, multi-timeframe logic — typed primitives with exact math. Never improvised.
strategy_a4f2…identicalstrategy_a4f2…identical✓ Zero drift between runs
What you tested is what deploys
100% deterministic builds with git-style versioning and frozen backtest snapshots — byte-for-byte reproducible.
One dashboard. Your whole book.
Every strategy runs in its own broker sub-account — clean P&L by construction, diversification you can actually see, and an OFF switch on everything.
Allocation by strategy · illustrative product view
NY Open Breakout
Futures · ES · own sub-account
+12.4%
Sharpe
1.82
Max DD
-6.2%
Alloc
34%
Vol-Filtered Momentum
Equities · own sub-account
+8.1%
Sharpe
1.41
Max DD
-8.4%
Alloc
28%
Mean Reversion Basket
Equities · own sub-account
-2.3%
Sharpe
0.63
Max DD
-9.8%
Alloc
22%
Session Fade
Futures · NQ · own sub-account
+5.6%
Sharpe
1.18
Max DD
-4.9%
Alloc
16%
Risk decomposition
backtested · illustrative
See why you're diversified, not just that you are.
Figures are historical simulations, not guarantees of future performance. Nothing runs that you can't stop in one click.
Simple, flat pricing
Lite and Pro both start with a free 5-day trial. Every plan includes the natural-language builder and institutional-grade backtesting.
$468 billed yearly
Free 5-day trial
Includes everything for beginners:
- US equities + 44 futures
- 5-year backtest history
- Natural-language builder
- Performance score
- Build + backtest tokens: Unlimited during Open Beta
$1,188 billed yearly
Free 5-day trial
Includes everything in "LITE" plan, plus:
- 10-year backtest history
- Full score + robustness suite
- Live trading (real money)
- Live P&L dashboard
- Buy, subscribe to strategies
- 5 concurrent live strategies
- Build + backtest tokens: Unlimited during Open Beta
$2,268 billed yearly
Includes everything in "PRO" plan, plus:
- Full backtest history (since 2007)
- 10 concurrent live strategies
- Highest build + backtest tokens: Unlimited during Open Beta
- Sell, publish strategies
Limited time: all Open Beta users get unlimited token usage.
The questions traders
actually ask.
Straight answers — including the uncomfortable ones. All performance figures are historical backtests, not promises.
Build
Backtest
Deploy
Plans & what’s next
Ready to test your first strategy?
The Open Beta is live. Start a free 5-day trial on Lite or Pro — and for a limited time, every Open Beta user gets unlimited token usage.
Free 5-day trial on Lite & Pro · No card required to start